Local City Guides
Top Housing Markets in 2026: Where the Growth Is, What It Costs, and How to Judge a Market Yourself
Updated August 15, 2026Consumer Guide

On this page (11 sections)
- Quick answer
- What does the 2026 housing market actually look like?
- Which markets did NAR name for 2026?
- What makes a market a hot spot in this method?
- Does a hot market mean a good market for you?
- What does a 4% price rise actually cost?
- How much do rates move that math?
- What should diverse and LGBTQ+ buyers check that no market ranking shows?
- How do I judge a market myself in an hour?
- What if my market is not on any list?
- FAQ
The top housing markets in 2026, according to the National Association of REALTORS®, are Charleston, Charlotte, Columbus, Indianapolis, Jacksonville, Minneapolis-St. Paul, Raleigh, Richmond, Salt Lake City, and Spokane. NAR expects existing-home sales and the median price each to rise about 4% this year, with mortgage rates averaging around 6.5%.
Those are real numbers from a real methodology, and they are still not a shopping list. A market that is good for sellers, builders, and agents is not automatically good for you, and no national index measures whether a place will treat your household fairly. This guide covers what the 2026 data actually says, what a 4% rise means in dollars, what the lists cannot tell you, and how to judge a market for yourself in about an hour.
Quick answer
- NAR's 10 hot spots for 2026: Charleston SC, Charlotte NC, Columbus OH, Indianapolis IN, Jacksonville FL, Minneapolis-St. Paul MN, Raleigh NC, Richmond VA, Salt Lake City UT, and Spokane WA.
- Each had to beat national averages on at least five of ten indicators and have a population above 250,000.
- NAR forecasts existing-home sales up about 4% and the median price up about 4% in 2026, with rates averaging about 6.5%.
- The national median existing-home price is around $430,000, and NAR estimates the typical homeowner gains roughly $16,000 in housing wealth this year.
- On a median-priced home, a 4% price rise adds about $3,400 to a 20% down payment and about $87 to a monthly principal-and-interest payment.
- "Hot" measures market activity, not affordability, safety, or whether local law protects you.
- Legal protections vary by state and city, and no hot-spot ranking accounts for them.
- A market missing from every list can still be the right market for you.
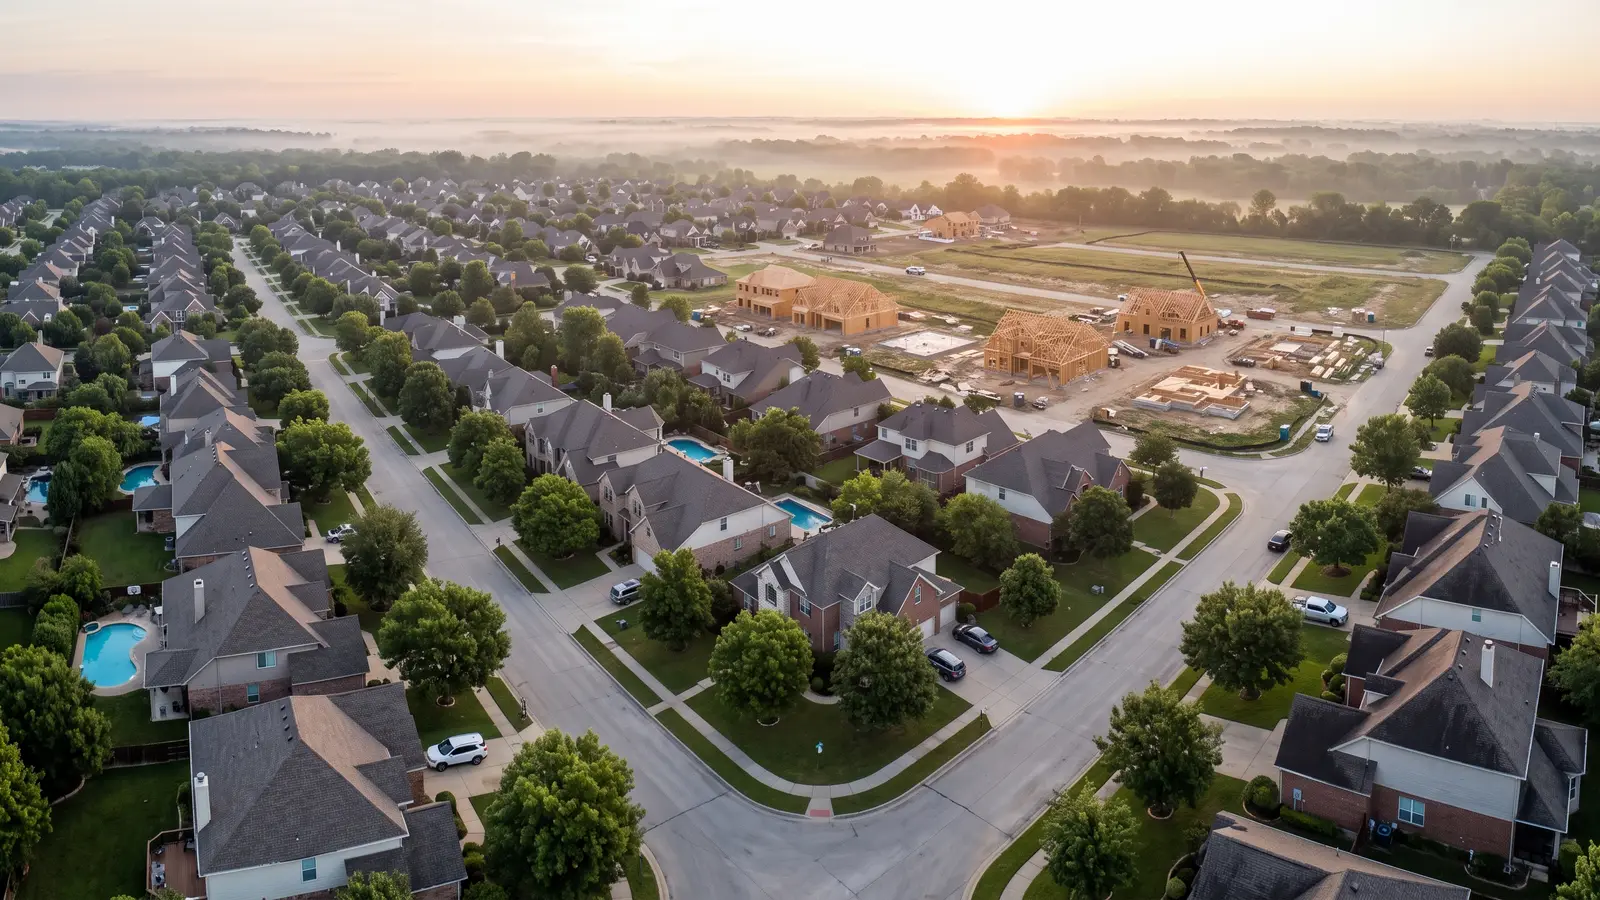
What does the 2026 housing market actually look like?
NAR's June 2026 outlook expects existing-home sales to rise about 4% for the year, with the median existing-home price up about the same, and mortgage rates averaging around 6.5%. The national median existing-home price sits near $430,000, and NAR estimates the typical homeowner will gain roughly $16,000 in housing wealth over the year.
Two things follow from that. Prices are still climbing, so waiting is not free. And they are climbing slowly enough that this is not a market rewarding panic. A 4% year is an ordinary year.
Worth naming plainly: this is a forecast from one organization, and NAR revised its own 2026 sales projection downward from an earlier, much larger number as rates moved. Treat any forecast as a current best estimate rather than a fact about the future.
Which markets did NAR name for 2026?
These ten, listed alphabetically in NAR's December 2025 release rather than ranked against each other:
| Market | State | Why it appears |
|---|---|---|
| Charleston | South Carolina | Beat national averages on at least 5 of 10 indicators |
| Charlotte | North Carolina and South Carolina | Job and income growth, migration |
| Columbus | Ohio | Affordability relative to income |
| Indianapolis | Indiana | Payment-to-rent math |
| Jacksonville | Florida | Migration and permit growth |
| Minneapolis-St. Paul | Minnesota and Wisconsin | Income and inventory alignment |
| Raleigh | North Carolina | Millennial share, job growth |
| Richmond | Virginia | Listings-to-income alignment |
| Salt Lake City | Utah | Permits and originations growth |
| Spokane | Washington | Sensitivity to lower mortgage rates |
NAR's chief economist Lawrence Yun tied the selection to conditions rather than to the places themselves: "Lower mortgage rates and larger inventory will attract buyers back to the market in 2026."
What makes a market a hot spot in this method?
NAR scored metro areas on ten economic, demographic, and housing indicators, required a population above 250,000, and kept the markets that outperformed national averages on at least five.
The ten indicators
Share of millennial households, household income growth, job growth, the impact of lower mortgage rates, domestic migration as a share of population, share of sales with price cuts, the listings-to-income alignment score, the mortgage payment versus rent ratio, single-family permits growth, and mortgage originations growth.
What that list rewards
Read those indicators closely and you can see the profile they select for: places where people are moving in, jobs and incomes are growing, builders are permitting, and prices have not yet fully outrun local wages. It is a measure of momentum and headroom.
What it does not measure
Nothing on that list measures whether a place is welcoming, whether local law protects your household, school quality, climate risk, or your commute. Those are not oversights. They are simply outside what the index is for.
Does a hot market mean a good market for you?
Not necessarily, and the distinction matters most for buyers on a tight budget.
A market with rising migration and strong job growth is a market with more competition for the same houses. "Momentum" from a seller's or an agent's point of view often reads as "harder" from a first-time buyer's. Meanwhile, a market nobody has ranked can offer a shorter wait, less bidding pressure, and a seller willing to negotiate.
The useful way to read a hot-spot list is as a description of where activity is concentrating, not as a recommendation.
What does a 4% price rise actually cost?
Run it on the national median rather than in percentages, because percentages hide the number that hits your bank account.
Take a $430,000 home with 20% down and a 30-year loan at 6.5%. That is $86,000 down and a $344,000 loan, which works out to roughly $2,175 a month in principal and interest.
Now apply a 4% price rise. The same home is $447,200. The 20% down payment becomes $89,440, and the loan becomes $357,760, or roughly $2,261 a month.
So a 4% year costs about $3,440 more up front and about $87 more a month, before taxes, insurance, and any HOA. That is the real shape of "prices rose 4%." Your own numbers will differ with your down payment, credit, loan program, and location, and a lender can price your actual scenario in a single conversation.
How much do rates move that math?
More than price does, at these levels. Rates are the reason NAR revised its own sales forecast downward during 2026, and they are the variable most likely to change your monthly payment between now and closing.
This is why comparing lenders is not optional. Apply to more than one inside a short shopping window, keep every Loan Estimate, and compare them line by line. Two Loan Estimates for the same borrower on the same day are also the clearest evidence that exists if the terms you are offered differ from what your file supports.

What should diverse and LGBTQ+ buyers check that no market ranking shows?
Legal protection, and it varies by state and city.
The federal Fair Housing Act covers race, color, religion, sex, familial status, national origin, and disability. Sexual orientation and gender identity are not separately named, though HUD has enforced the sex provision to include them, and many states and cities protect them explicitly. Roughly half of states go further than the federal list, and some add source of income or marital status.
None of that appears in a hot-spot ranking. A market can lead every economic indicator and still sit in a state with no explicit protections for your household, and the reverse is equally true. Before you commit to a metro, check the protections that actually apply there, and read our guide to what fair housing law covers and where the gaps are.
How do I judge a market myself in an hour?
A short, concrete pass beats any national ranking for your own decision:
- Price the payment, not the price. Ask a lender for a Loan Estimate on a realistic target price in that metro.
- Check the protections. Look up state and local fair housing coverage for the specific city, not just the state.
- Read the inventory. How many listings sit in your range, and how long have they been listed?
- Look at price cuts. A high share of reduced listings signals room to negotiate.
- Test the commute and the daily route, not just the neighborhood.
- Talk to two agents who work that market, and ask each what they would warn a buyer about.
If a market survives all six, it is a better fit for you than any list can establish.
What if my market is not on any list?
Then you are shopping with less competition, which is usually an advantage.
Lists exist to describe aggregate activity. Most people buy where their work, family, and community already are, and none of those show up in a national index. A market with flat prices and patient sellers can be a far better place to buy your first home than a hot spot where you are the fifth offer.
The right questions stay the same everywhere: can you afford the payment, does the law protect you, and is the person representing you actually on your side. Our guides on choosing an agent and who pays that agent now cover the last one.
FAQ
What are the top housing markets for 2026?
NAR named ten hot spots for 2026: Charleston, Charlotte, Columbus, Indianapolis, Jacksonville, Minneapolis-St. Paul, Raleigh, Richmond, Salt Lake City, and Spokane. They are listed alphabetically, not ranked against one another.
How were those markets chosen?
Each had to have a population above 250,000 and outperform national averages on at least five of ten indicators, including job growth, household income growth, domestic migration, single-family permits, and the mortgage-payment-to-rent ratio.
What is the 2026 housing market forecast?
NAR expects existing-home sales to rise about 4% and the median home price to rise about 4% in 2026, with mortgage rates averaging around 6.5%. NAR revised its sales forecast down during the year as rates moved, so treat it as an estimate rather than a certainty.
What is the median home price in the US right now?
The national median existing-home price is around $430,000. NAR estimates the typical homeowner will gain roughly $16,000 in housing wealth over 2026.
How much does a 4% price increase cost a buyer?
On a $430,000 home with 20% down at 6.5% over 30 years, a 4% rise adds about $3,440 to the down payment and about $87 to the monthly principal and interest payment, before taxes and insurance.
Does a hot housing market mean it is a good place to buy?
Not automatically. Hot-spot rankings measure activity, migration, and building, which often means more competition for the same homes. They do not measure affordability for your budget, legal protections for your household, or whether a market is welcoming.
Do these rankings account for LGBTQ+ or civil rights protections?
No. NAR's indicators are economic, demographic, and housing based. Protections for sexual orientation and gender identity vary by state and city and must be checked separately for the specific place you are buying.
Should I wait for prices to fall before buying?
That is a personal financial decision and depends on your situation. What the data shows is that NAR expects prices to rise about 4% in 2026 rather than fall, and that rate movements affect a monthly payment more than price movements do at these levels. A lender can price your specific scenario, and that is a better basis than any national forecast.
Keep reading



Own or know an inclusive business?
List it free so people can discover it year-round — with a source you control.
List your business